#To access the values, write the object name and use square brackets to access either row or column values e.g. data[row,column]
MMILabData[1,] #Access the 1st row values
MMILabData[,1] #Access the 1st column values
MMILabData$Age #By using a $, we can access column values by the name of the column
MMILabData[2,3] #Access a specific value from the table4 Tutorial 1: Working in R, boxplots, Chi-sq and T-tests
4.1 Load the Measurements Data in R
Download the ‘MMILabData.csv’ data file from Moodle.
Note
.csv formats mean comma separated values. What this means is that entries in the data are separated by commas.
If we looked at the data in something like Notepad or Text Edit then we could see that format:

If we opened this in Excel and saved it, then the format would be altered. So if you do open it in Excel, don’t save it.
Otherwise, we can directly open this format in R!
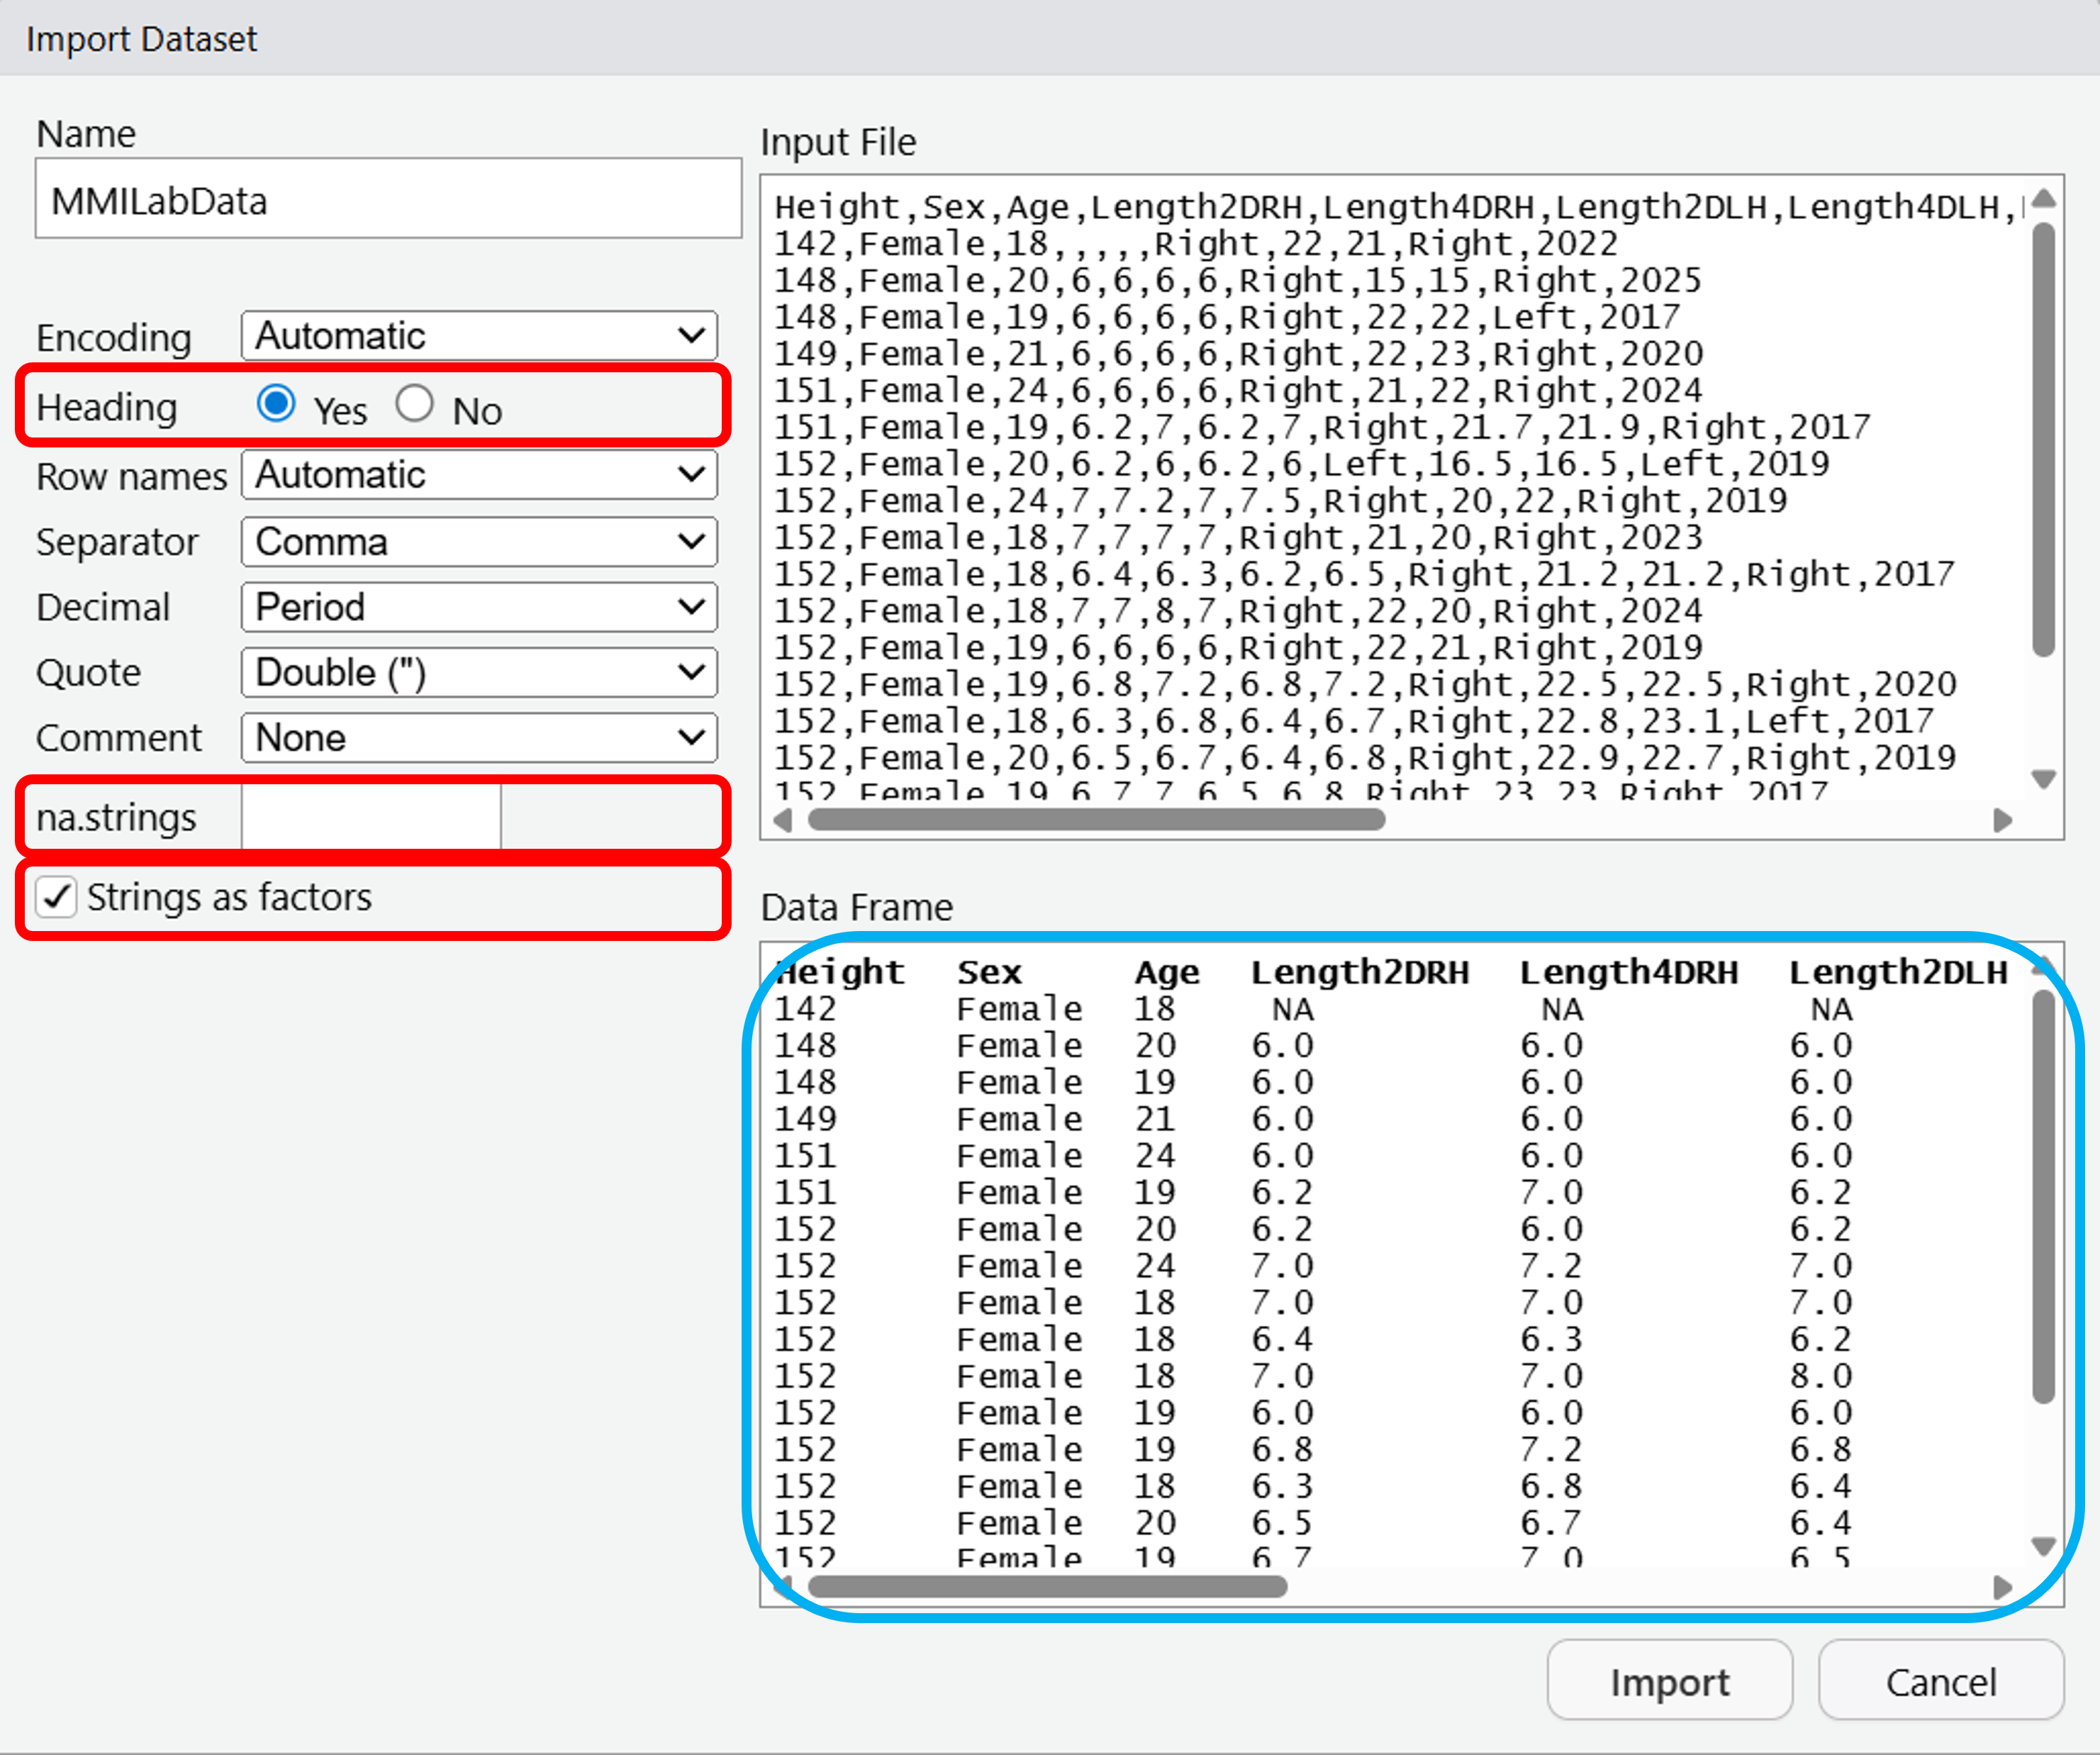
To import the dataset, you’ll want to click File > Import Dataset > From Text (base)…
Navigate to the MMI_Lab_1 folder that you previously created in Understanding R, and click on MMILabData.csv.
A window will open up, from there it gives a number of options for importing your dataset.
We will change the Heading to Yes - this means that we treat the first row of data as the headers, or the column names.
We will also change the na.strings from NA to blank - this removes any missing data from the dataset.
Lastly, tick the box for Strings as factors - this will convert any text values in the data to factors. These are just categorical data that can take fixed values - we have information in our dataset on sex, a factor for this sex data column could be “Female” or “Male” and if we say that it should be a factor then it works better for plotting.
Your dataset should look like the Data Frame highlighted in blue. You can now click Import.
4.2 Looking at the data
You’ll notice that once we’ve imported the data, it is loaded into the Environment pane, so we can access the data any time we like.
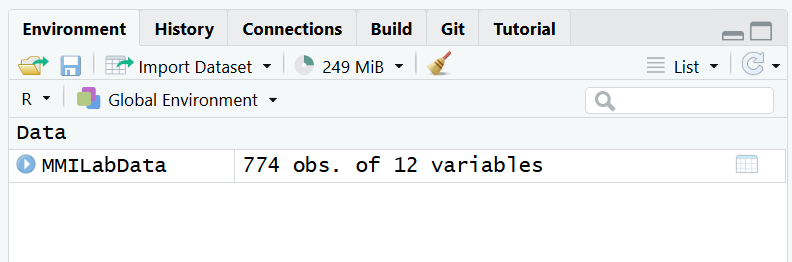
To check the contents of this Data Frame, you can click the name (MMILabData) of the object in the Environment pane.
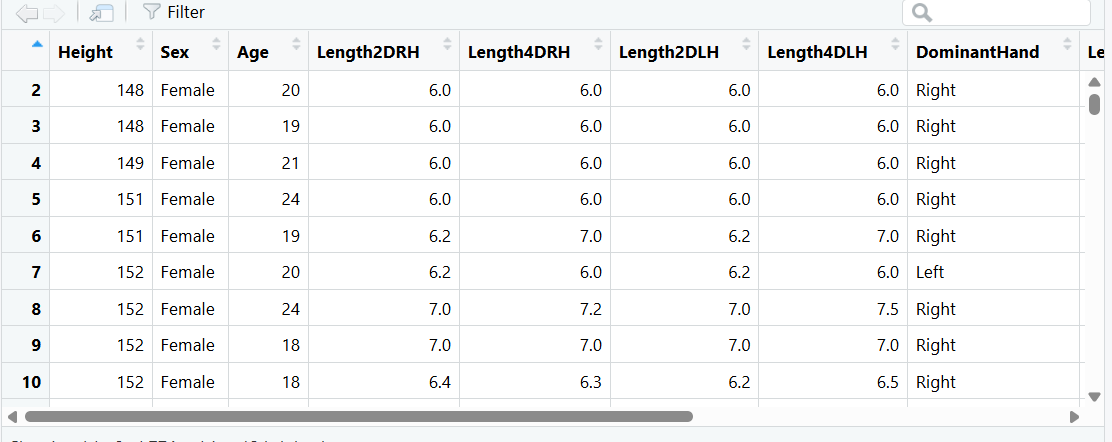
The MMI data comprises a collection of data from previous students over a number of years. Have a look through it to understand what sort of data it contains.
If you wanted to access particular values, you can access it in the code using the index corresponding to either row or column values:
Looking at the data variables being examined, is Height continuous or categorical data?
Looking at LengthLeftFoot, is this continuous or categorical data?
Looking at Sex, is this continuous or categorical data?
Looking at Age, is this continuous or categorical data?
Most of these should be fairly intuitive - but if you need help consider reading: What’s the difference between categorical and continuous data?
For Age, this is considered discrete - not continuous. We’re taking the whole integer rather than e.g. instead of saying “I’m 28.6 years old” we’re just saying “I’m 28 years old”. R will therefore treat it as a categorical variable.
4.3 Determining the mean, median, minimum, and maximum value of a column
Once you’re familiar with the dataset, let’s run some functions:
What are the outputs of each of these functions on Height?
Mean:
Median:
Min:
Max:
Run the above functions in your script, and insert the exact answers from the console into the text boxes.
You can also use the summary function to investigate all the variables.
Note that so far we’ve only investigated continuous data, but we can also investigate categorical data.
There are males in the dataset, and females in the dataset.
You should be able to read the values from the summary() function.
If exact values are not returned, it’s likely that you are either using the wrong column, or you did not import the data correctly.
Look back at Step 1 to ensure that you have included Strings as factors, and re-read this section to understand why we do this.
4.4 Plotting data in R - Boxplots
To visualise the data, we’ll use functions.
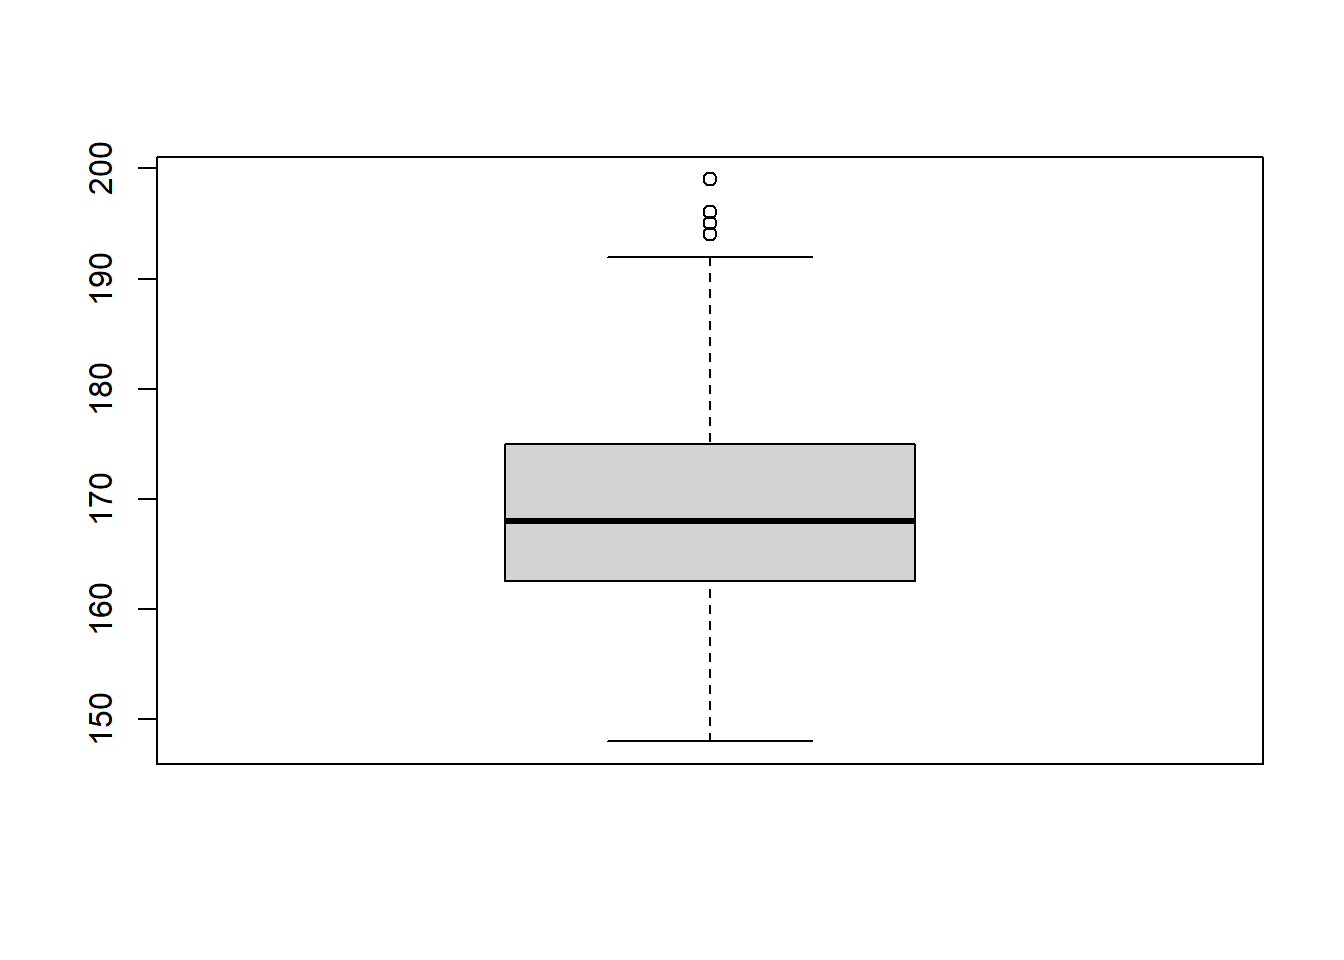
Draw a boxplot of the variation in Height using the boxplot command:
What is the null hypothesis for the proportion of females and males in the MMILabData dataset?
This just concerns establishing null hypotheses for the sort of questions that we’re looking to ask of the data.
The null hypothesis is always saying that there should be no relationship or difference between the variables we’re investigating.
With that being the case, we should say that the null hypothesis is that there’s no significant difference between the proportions of males and females.
We’ve done no test at this point, so we can say nothing about there being more of either variable.
4.5 Using the chi-squared test
Using the chi-squared test, we can determine whether the proportion of females and males deviates from expected under the null hypothesis, as in the previous question.
Calculating the chi-squared test is easy to do - but we can use the chisq.test in R to do this even more easily:
    Chi-squared test for given probabilities

data:  table(MMILabData$Sex)
X-squared = 672.77, df = 2, p-value < 2.2e-16
Remember when performing a chi-squared analysis we must use the number of observations, not the relative proportions of observations in each category.
What is the chi-squared value for the observed proportion of females and males in the MMILabData dataset relative to that expected under the null hypothesis?
Let’s look at the output of the chi-sq test to see where the information is coming from.
For question 1, the chi-squared value is our X-squared statistic, so this value is just 672.77. What does this value actually mean? Let’s look at an excerpt of the chi-square table.

The degrees of freedom is determined as n -1.
Because we only have two factors (male or female) this means n = 2, so the degrees of freedom (df) is 1 (2 - 1).
If we go down the rows on the chi-sq table, we can see the degrees of freedom. At a df of 1, we compare our chi-squared value with the values in here. Our value of 672.7674419 is much higher than the values on the table - so our probability of observing this value is well below 0.005 - so this is a very significant result.
Let’s imagine the chi-squared value was 1 with the degrees of freedom also 1, then we would see on the table that this value would sit between a probability value of 0.90-0.10, which is not significant.
The exact value of the probability value is also given in the summary table for the chi-sq test we do in r, and this value is 8.1359112^{-147}.
So, based on these results we can reject the null hypothesis that the proportion of females and males in the sample is equal, and say that it is extremely unlikely that we would have observed as big of a difference in the ratio of males and females as expected under the null hypothesis of equal numbers.
For a reason why the observed proportion of females and males is different to that expected under the null hypothesis, all of the options are valid - whenever you have a statistical result, try to think of possible reason as to why the data may be reflecting this way.
How does the observed proportion of females and males in the MMILabData dataset differ from that expected under the null hypothesis? Fill in the blanks:
There are females than expected under the null hypothesis in the MMI dataset.
From the barplots and the boxplots we have created, we can see that there are more females than males in the dataset - so now we know that the null hypothesis can be rejected, we can observe where the difference lies.
What is the probability of observing this difference between female and male proportions, if the true population proportion was 50:50?
The exact value of the probability value is also given in the summary table for the chi-sq test we do in r, and this value is 8.1359112^{-147}. Typically, the threshold is just given in the form < 2.2e-16, which is an extremely low value - just to say this is a very very significant result.
Should we be inclined to accept or reject the null-hypothesis? Fill in the blanks below:
As the p-value is 0.05, the chi-squared analysis suggests that it is extremely that we would have observed as big of a difference in the ratio of males and females as expected under the null hypothesis of equal numbers. Therefore, we should be inclined to the null hypothesis.
What might explain the difference between the observed proportion of females and males in the MMILabData dataset relative to that expected under the null hypothesis?
For a reason why the observed proportion of females and males is different to that expected under the null hypothesis, all of the options are valid - whenever you have a statistical result, try to think of possible reason as to why the data may be reflecting this way.
In the real-world, you would interpret the results of your statistical test with your own theories or link to literature from papers.
4.6 Comparing sets of data with boxplots
Previously, we plotted Height as a boxplot.
Now, wouldn’t it be interesting to compare multiple groups with the same units, e.g. the length of the left foot against the length of the right foot, to see how they differ.
To select two variables to highlight on the same plot, combine both together into the same function:
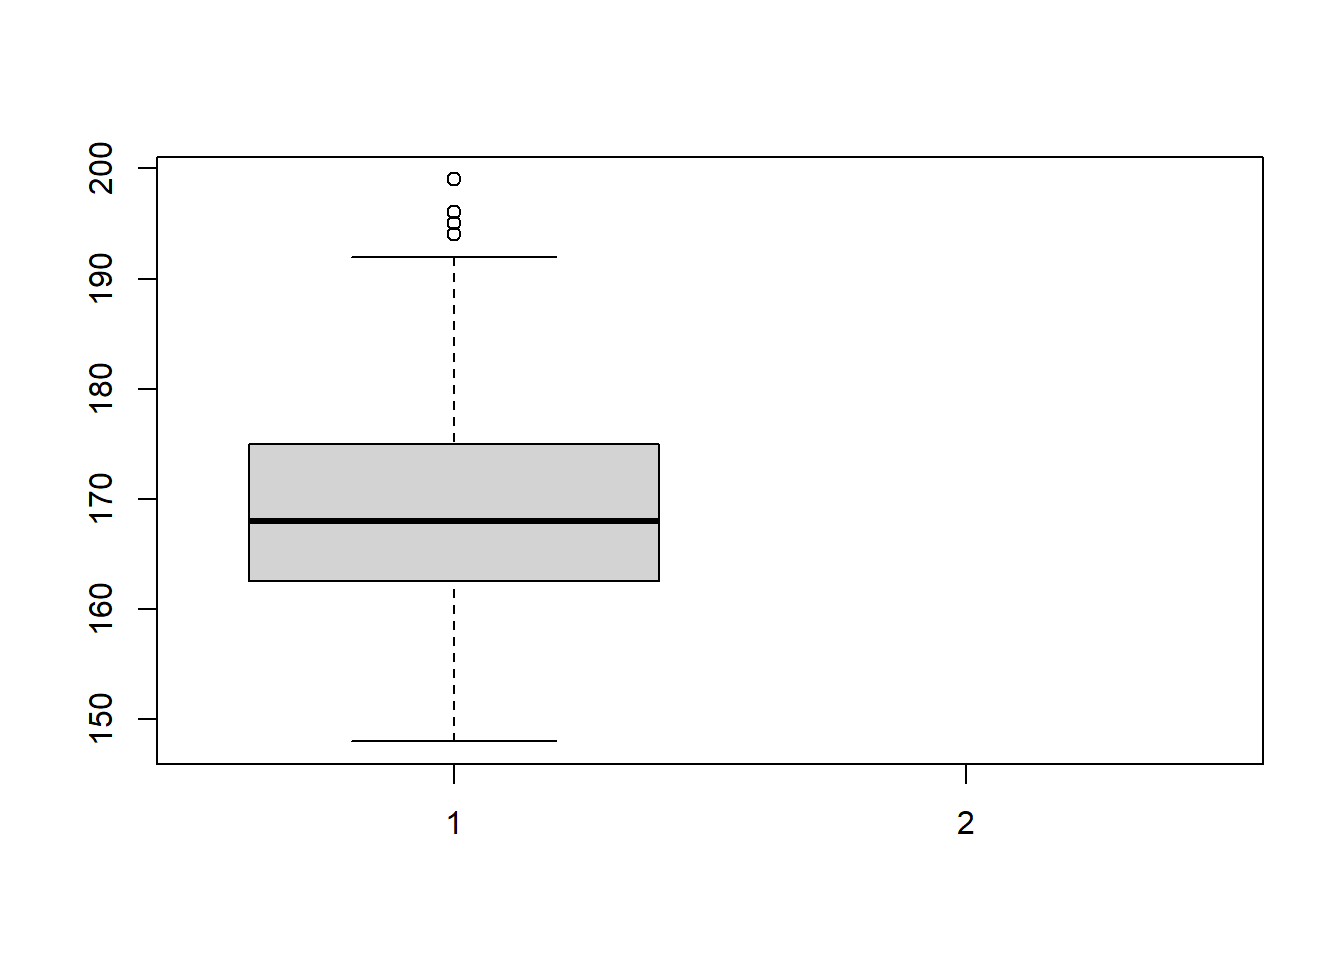
Looks good - if you want the names of the boxplots to correspond to either variable, try adding an argument to the function like names = c("Height", "Weight") as it goes in order of what you’ve plotted.
What is the null hypothesis for the relationship between the mean values of length left foot and the length right foot?
The null hypothesis would be that there is no difference in the mean of length of the left foot and the mean of length of the right foot.
We have also not performed the statistical test for this yet, so we could not say whether we accept or reject the null hypothesis.
Note that the question is comparing the means (or population averages), while the question of the previous tutorial for the chi-squared test was comparing proportions of males and females. These different questions will have different null hypothesis.
For comparing means, we have to use T test. To determine if there is a significant difference between observed and expected frequencies, we use the Chi-squared test.
4.7 Perform a T test
Perform a T test comparing the means of the LengthLeftFoot and LengthRightFoot. For this, we use the t.test function:
    One Sample t-test

data:  MMILabData$Height
t = 503.41, df = 773, p-value < 2.2e-16
alternative hypothesis: true mean is not equal to 0
95 percent confidence interval:
 168.4477 169.7666
sample estimates:
mean of x
 169.1071
What is the difference in mean length of Height and Weight?
What is the probability that we would have observed a difference of this magnitude if the null hypothesis were correct?
Should we reject the null hypothesis?
To find the difference in mean length, we simply look at the output of running the t.test - you’ll see the last entry reads:
sample estimates:
mean of x mean of y
161.4700 68.7111
And this is simply the mean of x (Height) and the mean of y (Weight) - or whatever order you put these variables in the function, e.g. `t.test(x,y)`. To find the difference, do (mean x) - (mean y).
The probability of observing this difference if the null hypothesis were correct is simply given by the p-value, which you can see on the output is < 2.2e16.
This p-value is very low, and far less than 0.05. So therefore, we reject the null hypothesis. The p-value suggests that it is extremely unlikely we would have observed the difference in mean Height and Weight by random sampling error if the null hypothesis was correct.
So therefore, it looks like there’s a real difference in the mean of Height compared with Weight - which makes sense as someones Height is not entirely predictive of Weight