5 Tutorial 2 - Scatter plots and Linear Regression
5.1 Load the Measurements Data in R
We will utilise the same dataset that we used in the previous data analysis lab, the MMILabData.csv dataset.
Load that dataset into R again, using the 1st tutorial instructions if required.
Note
We recommend working on the same R script that you used previously, as it’s the same dataset and makes it easier if all the code for functions and visualisation are on the same script, rather than multiple locations.
5.2 Make a Scatter plot comparing continuous variables
To generate a scatter plot between a two variables we’ll use the tilde symbol ~
We could have just used a , between the variables and the plot would look the same.
However, we’re investigating a relationship so it’s good practice to start using the ~ as in a formula for exploring a relationship we typically use the format dependent_variable ~ independent_variable where we essentially ask: “how is the dependent variable affected by the independent variable?
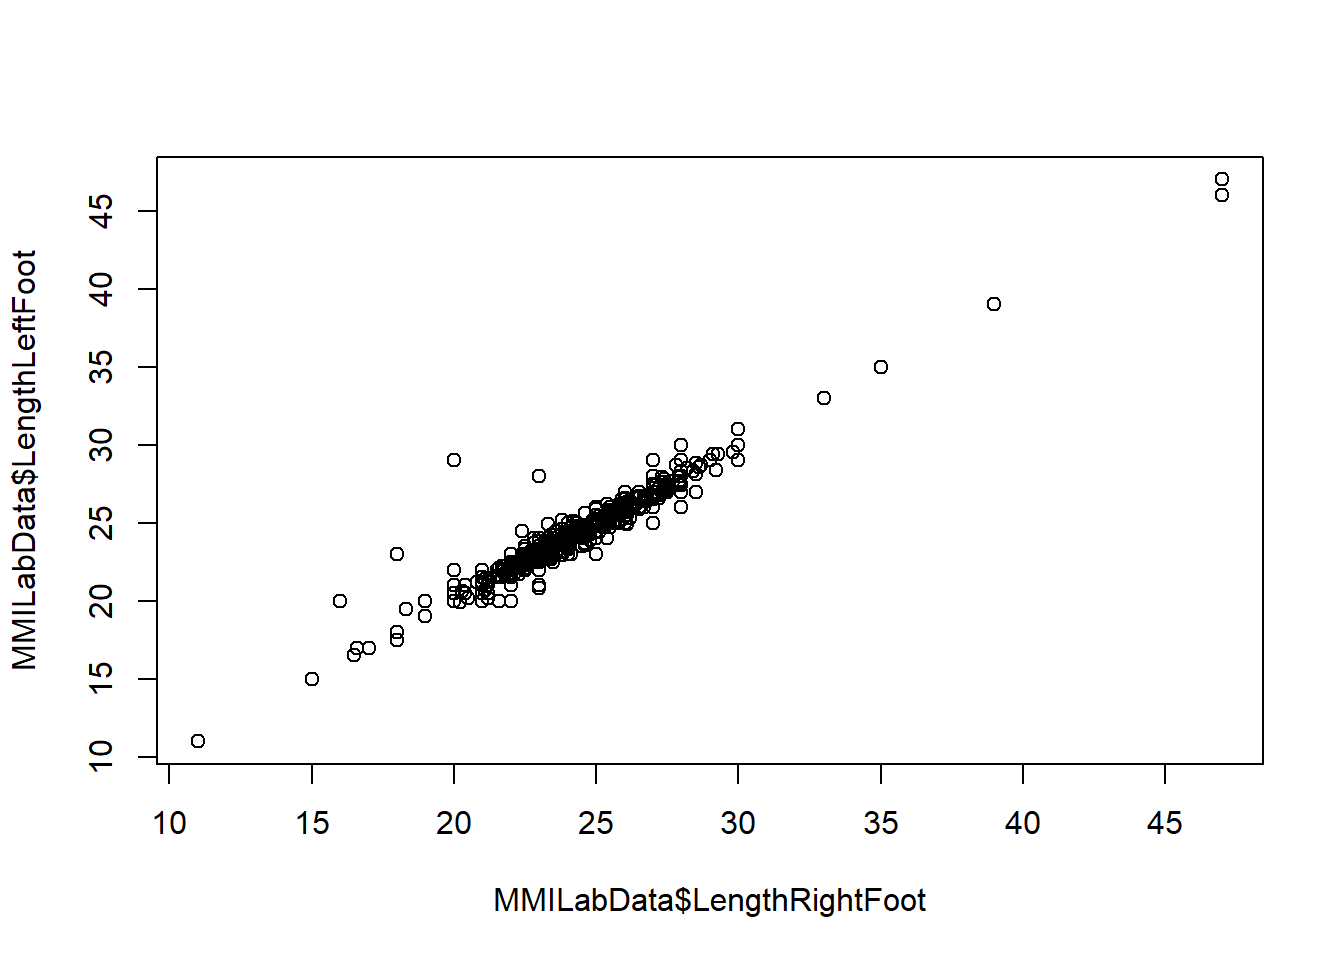
E.g. how is the length of the left foot affected by the length of the right foot (or what is the relationship)?
You’ll see more of this later, but for now always use a ~ instead of a , .
What is the null hypothesis for the relationship between the LengthLeftFoot and LengthRightFoot?
The null hypothesis would be that there is no association between the LengthLeftFoot and the LengthRightFoot.
We have also not performed the statistical test for this yet, so we could not say whether we accept or reject the null hypothesis.
Note that this question relates specifically to the association between these two variables in individuals (i.e., does knowing anything about one variable provide any information about the other variable in a pair of observations from an individual)
Note that the question is asking about the association between these two variables in individuals (so does knowing the values of one variable provide information about the other variable in individuals).
The previous question for the T test was asking about comparing the means (or population averages) - so this is different from the relationship. As this is a different question, our null hypotheses will be different.
To determine if there is a significant association between the two variables, we will use a regression analysis.
5.3 Perform Linear Regression
To investigate the relationship between LengthLeftFoot and LengthRightFoot, we’ll run a linear regression analysis.
In this case, the LengthLeftFoot will be our response variable and LengthRightFoot will be our explanatory variable:
Response_variable ~ Explanatory_variable
What we’re asking is: how is the LengthLeftFoot (Response Variable) affected by changes in the LengthRightFoot (Explanatory Variable).
The actual function to run linear regression is simply lm, but to simplify the output we’ll run summary on the results.
Call:
lm(formula = MMILabData$LengthLeftFoot ~ MMILabData$LengthRightFoot)

Residuals:
    Min      1Q  Median      3Q     Max
-2.2540 -0.2441 -0.0315  0.1875  8.8110

Coefficients:
                           Estimate Std. Error t value Pr(>|t|)
(Intercept)                1.088848   0.230178    4.73 2.66e-06 ***
MMILabData$LengthRightFoot 0.955005   0.009458  100.97  < 2e-16 ***
---
Signif. codes:  0 '***' 0.001 '**' 0.01 '*' 0.05 '.' 0.1 ' ' 1

Residual standard error: 0.6897 on 772 degrees of freedom
Multiple R-squared:  0.9296,    Adjusted R-squared:  0.9295
F-statistic: 1.02e+04 on 1 and 772 DF,  p-value: < 2.2e-16
The output looks intense, but it’s easily understandable once you know what to look for.
For now, let’s add use the output of the lm to add a regression line (or line of best fit) to our scatter plot!
By running the below code, you should have a regression line added to your scatter plot:
Warning
If this hasn’t worked, make sure that you have:
Made the plot and it shows in the plot panel
You have used the
~instead of the,in the plot function
Now, let’s go back to the output of the summary(lm) and see if we can determine some answers from it.
How much of the variation in LengthLeftFoot can be predicted by LengthRightFoot?
Determining how much of the variation in LengthLeftFoot can be predicted by knowing the LengthRightFoot is given by the Adjusted R-squared value - so 0.9295 .
If we multiplied this answer by 100, we obtain the percentage variation of the explanatory variable affecting the response variable.
E.g. if R-squared was 0.9, then 90% of the variability in LengthLeftFoot can be explained by its relationship with LengthRightFoot.
What is the probability that we would have observed an association of this magnitude if the null hypothesis were correct, and we had collected a random sample of the population? You can just copy the answer directly from the output.
The probability that we would have observed an association of this magnitude if the null hypothesis were correct, and we had collected a random sample of the population, is simply given by the p-value - which we can see is < 2.2e-16 so we’ll use that as an answer. Note that this is not the exact p-value, but just saying that the p-value is less than this very significant value.
Should we reject the null hypothesis?
Given that this p-value is less than 0.05 we would be inclined to reject the null hypothesis - suggesting that it is extremely unlikely that we would observe the association between these two variables if the null was correct and our sample was unbiased with respect to this parameter. Therefore, we can be highly confident in rejecting the null hypothesis.
What is the null hypothesis for the intercept value for the association between LengthLeftFoot and LengthRightFoot? (e.g, what null hypothesis can we think of for the value of the LengthLeftFoot, when the LengthRightFoot is set to 0). Choose 1 correct answer.
If we’re looking at the intercept, then the x-axis value is set to 0, and we’re asking what the value in our y-axis would be. If the x-axis is the length of the right foot and at the intercept this is set to the value of 0, does it make sense to assume the null hypothesis of the length of the left foot would be anything other than 0 as well?
What is the predicted intercept in the association test for LengthLeftFoot and LengthRightFoot?
The actual predicted intercept in the association test for LengthLeftFoot and LengthRightFoot is returned in the Coefficients section, looking at the (Intercept) and the Estimate section - which is 1.088848. So, when the LengthRightFoot is 0, the predicted LengthLeftFoot is 1.088848, which means that for most people they have a bigger left foot!
As an aside, the value below the (Intercept) is MMILabData$LengthRightFoot - the values here indicate the predicted increase in LengthLeftFoot with every unit increase of LengthRightFoot. So, for every unit increase in LengthRightFoot, there’s a predicted increase of 0.955005.
What is the probability that we would have observed an intercept of this magnitude if the null hypothesis were correct?
The probability that we would have observed an intercept of this magnitude is given in the same Coefficients section, at the end Pr(>|t|). We can see this is 2.66e-06
Should we reject the null hypothesis regarding the intercept? I.e., are we confident in saying that the length of the left foot is always bigger than the length of the right foot? HINT: Have a look at your scatterplot.
We’ve asked if we should reject the null hypothesis based on this information. Now, the p-value is less than 0.05 so it seems that we can be confident in rejecting the null hypothesis.
However, based on our biological knowledge there might not be any reason to expect that the intercept wouldn’t be zero. Does it make sense that one foot is 1cm bigger than the other?
If we look at the scatter plot, I’ve coloured each sample that had a 2cm difference between each foot length - we’ll see someone has a 20cm right foot and a 30cm left foot!
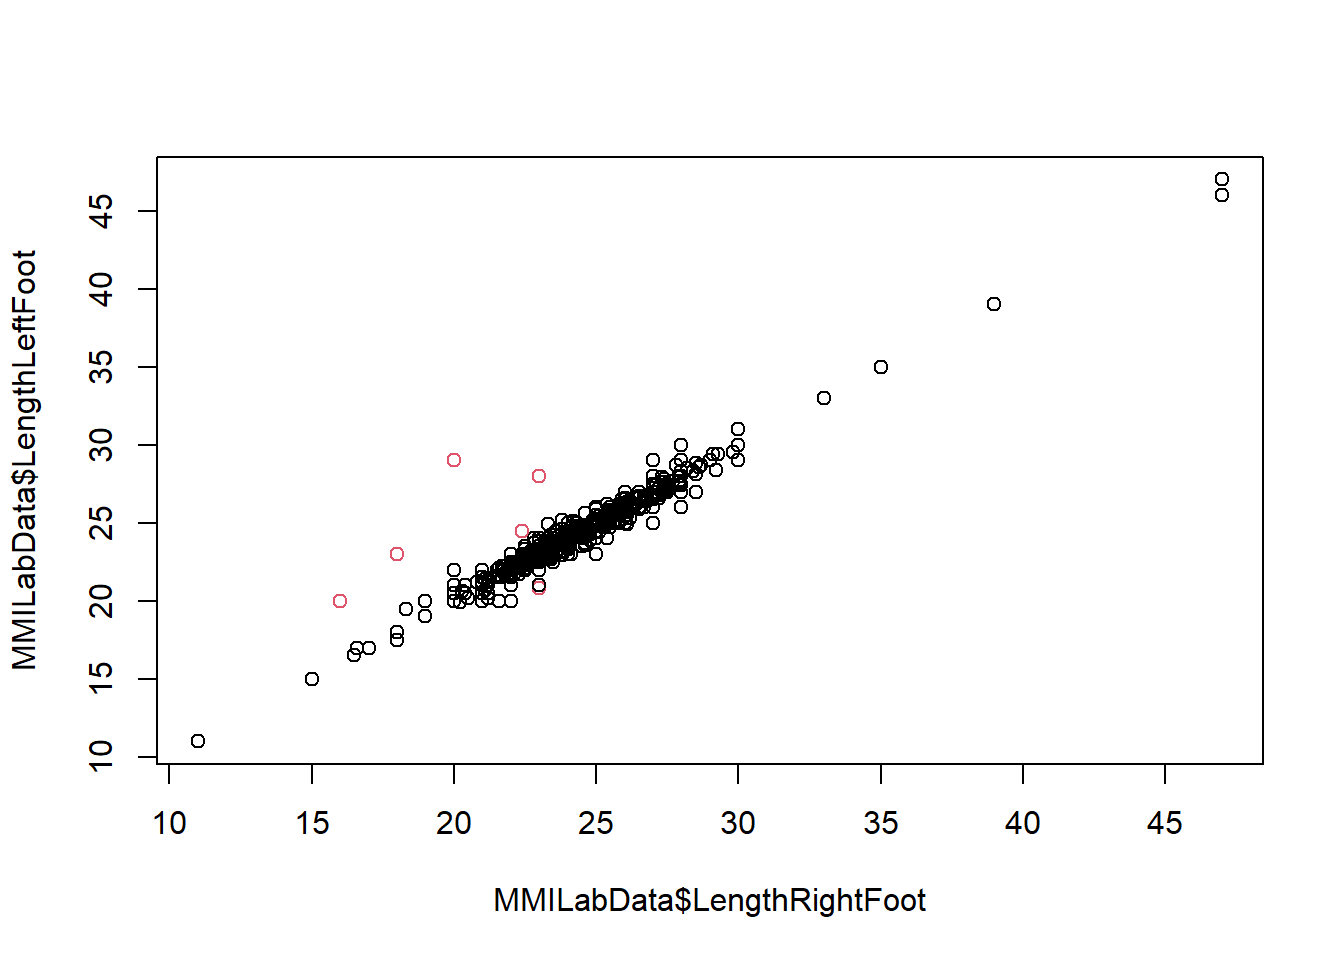
It is possible this is a measurement and/or reporting error, or that we have just been unlucky and happened to have a sample that has been skewed by one or a few individuals who happened to have longer left feet.
The latter would be an example of a type I error where we incorrectly reject the null hypothesis due to sampling error!
So, be wary of blindly accepting significant results - and think more on if the data is appropriate to begin with, or if the results make sense biologically!
Think about the results of your T test which compared the mean lengths, and the results of the linear regression which tested for the association between lengths. Do these results make biological sense?
The results mostly make sense. We expect the relationship between the length of the left and right foot to be very similar within an individual (balance would probably be an issue if we had very different feet lengths), but different between individuals, broadly dependent on their overall size.
If we went back to the T test we previously made, we saw that the result wasn’t significant and we couldn’t reject the null hypothesis, so there was a lack of difference in the population between the mean length of left and right feet - which isn’t surprising.
We also expect that the intercept for the association between length of left and right feet to be zero (i.e., someone with a very small right foot should have a very small left foot) which we mostly see, and for the majority of people there is no huge difference in feet length.
5.4 Using a categorical predictor
Now we’ll use what we’ve learned so far and apply this to new variables to investigate, so far we’ve investigated continuous data but now we’ll look at some categorical data to see how this differs.
Generate a boxplot of the LengthLeftFoot dependent on Sex.
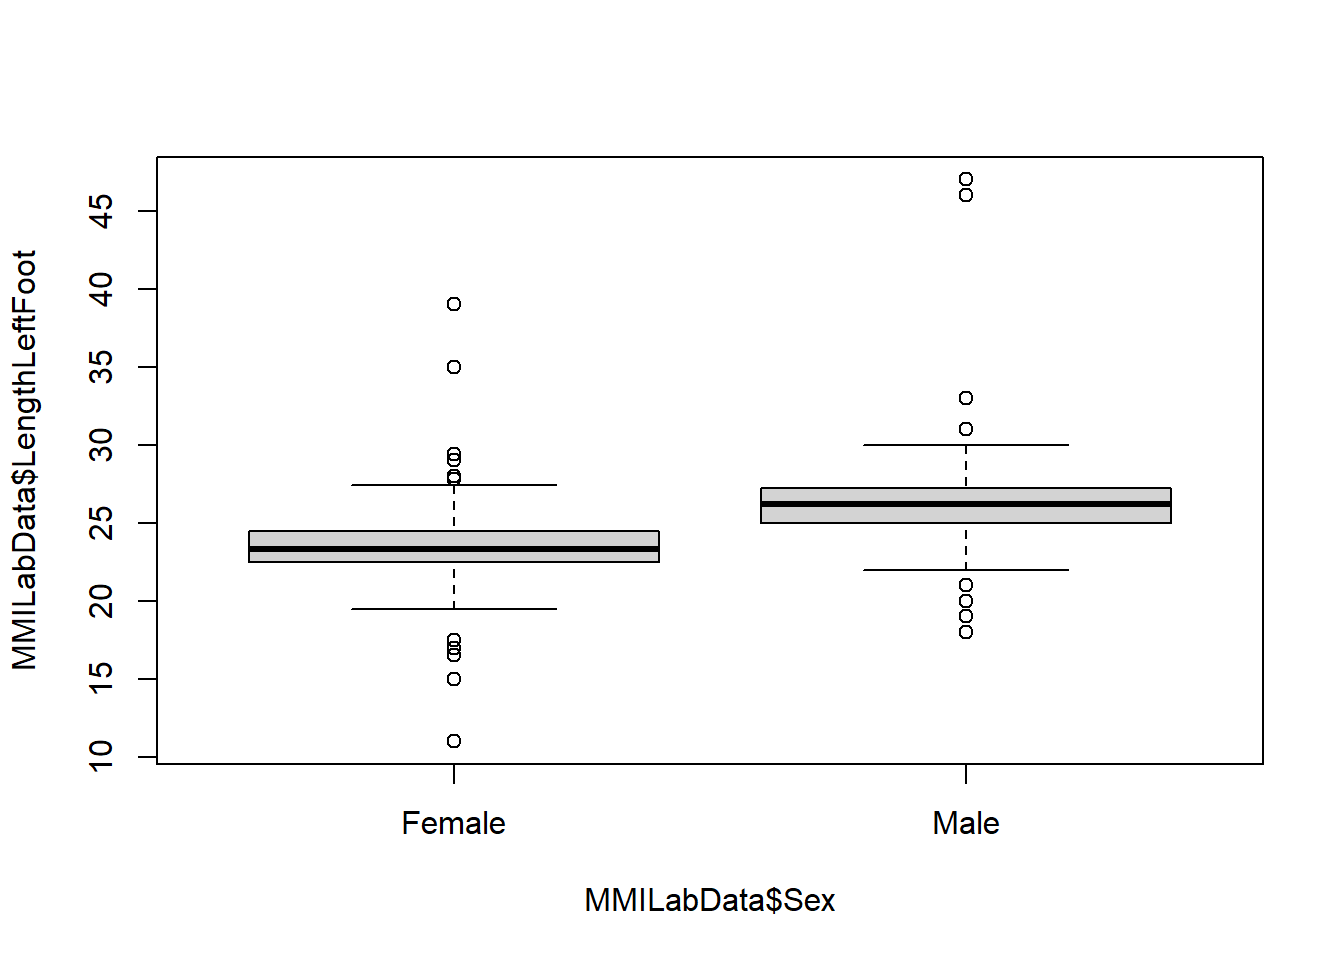
5.4.1 T-test of continuous variable dependent on categorical variables
Perform a T test to determine if the mean of LengthLeftFoot is dependent on being Male or Female.
    Welch Two Sample t-test

data:  MMILabData$LengthLeftFoot by MMILabData$Sex
t = -12.524, df = 264.99, p-value < 2.2e-16
alternative hypothesis: true difference in means between group Female and group Male is not equal to 0
95 percent confidence interval:
 -3.232783 -2.354399
sample estimates:
mean in group Female   mean in group Male
            23.49154             26.28513
Why did we use a ~ here, when we used a , to separate variables in the previous T test we did?
You might want to run ?t.test to investigate the arguments further to pick the correct answers.
There’s no such thing as “statistical matchmaking mode” - it’s total nonsense.
The other options are correct, and can be found in the ?t.test help panel.
Basically, because Sex is categorical (Male or Female in this case) and we’re investigating if LengthLeftFoot is dependent on Sex, we need to use the tilde. This is just a requirement of the function.
Previously, we could just use a comma because we were looking at comparing the means of two continuous variables.
Now try to answer the questions about the output of the t.test:
What is the difference in mean length of LengthLeftFoot between males and females?
The mean of the male LengthLeftFoot is 26.285128 and the mean of the female LengthLeftFoot is 23.491537.
Simply subtract the higher number from the other.
You can use R as a calculator, so just get the two values and write:
value1 - value2
What are the 95% confidence intervals for the difference in mean length of LengthLeftFoot between males and females?
to
The 95% confidence intervals for the difference in mean length of LengthLeftFoot between males and females is returned in the output under 95 percent confidence interval.
For question 3, the confidence intervals tell us how the range in which one level (Female) differs to another level (Male). This is why these values are negative, it tells us that the first level (Females) is less than the second (Males). The reason why it chooses Females first is a quirk of factors - it chooses the levels of a factor alphabetically, so it goes Females first then Males. To see this, you could run levels(MMILabData$Sex). If you wanted to reorder the levels to Males then Females, you could do so by running levels(MMILabData$Sex) = c("Males", "Females").
What does the confidence interval values tell us?
Females feet are on average than males.
The confidence intervals tell us how the range in which one level (Female) differs to another level (Male). This is why these values are negative, it tells us that the first level (Females) is less than the second (Males). The reason why it chooses Females first is a quirk of factors - it chooses the levels of a factor alphabetically, so it goes Females first then Males. To see this, you could run levels(MMILabData$Sex). If you wanted to reorder the levels to Males then Females, you could do so by running levels(MMILabData$Sex) = c("Males", "Females").
Now, perform a regression analysis to investigate the relationship between LengthLeftFoot and Sex.
Call:
lm(formula = MMILabData$LengthLeftFoot ~ MMILabData$Sex)

Residuals:
     Min       1Q   Median       3Q      Max
-12.4915  -1.1617  -0.1851   1.0085  20.7149

Coefficients:
                   Estimate Std. Error t value Pr(>|t|)
(Intercept)        23.49154    0.09552  245.93   <2e-16 ***
MMILabData$SexMale  2.79359    0.19031   14.68   <2e-16 ***
---
Signif. codes:  0 '***' 0.001 '**' 0.01 '*' 0.05 '.' 0.1 ' ' 1

Residual standard error: 2.299 on 772 degrees of freedom
Multiple R-squared:  0.2182,    Adjusted R-squared:  0.2172
F-statistic: 215.5 on 1 and 772 DF,  p-value: < 2.2e-16
How much of the variation in LengthLeftFoot can be predicted by Sex? Give this answer as a percentage, and round to nearest whole number.
So for variation being predicted, we look at the adjusted R-squared value. We now want to express this as a percentage, so multiply the adjusted R-squared value by 100.
What is the probability that we would have observed an association of this magnitude if the null hypothesis were correct?
2.2e-16
Let’s look at the p-value under adjusted R-squared, as we’re looking at the association.
What is the intercept for the regression analysis between LengthLeftFoot and Sex?
We’re looking at the intercept again - with a categorical predictor this time, Sex. The actual intercept for the regression analysis is given by the Estimate value.
With a categorical predictor in a regression analysis, the intercept is set to the first level in the categorical predictor - which in this case is Female as we assigned no set level, so it just works alphabetically.
So, we can see underneath the Estimate that if they are Male, there’s an increase.
Use the results of the regression analysis to produce a formula for predicting LengthLeftFoot dependent on Sex.
Length of the left foot = (+ if male) cm
As explained in the solution above, with a categorical predictor the intercept is set to the first level in which in this case is Female.
So, we can see underneath the Estimate that if they are Male, there’s an increase of 2.793591 .
As this is a categorical predictor, unlike the previous T-test in Tutorial 1 where we were looking at a continuous predictor (LengthLeftFoot), this is a unit increase if Male. If you remember, with a continuous predictor, it was a unit increase every time there was an increase in the predictor as well - have a look back to understand this.
What is the likely cause and effect relationship between LengthLeftFoot and Sex?
The results tell us that Females will have an average left foot length of round(lm_results2[["coefficients"]][1], digits = 6) cm, while males have an average left foot length of round(lm_results2[["coefficients"]][1], digits = 6)+ round(lm_results2[["coefficients"]][2], digits = 6) cm.
The effect of sex on average foot length does seem significant, (p-value < 2.2e-16), however based on the adjusted R-squared we can see that sex only accounts for round(lm_results2[["adj.r.squared"]]*100)) of the variation in the length of the left foot - so it is not the only reason for variation.
If we wanted to justify our answer, what could we say?
Here’s an example of trying to interpret the actual result of the statistical test, with reference to further literature.
If we based it solely on the result of the p-value, then we ignore the the fact that sex only explains a little of the variation in the length of the left foot.
Biological sex is defined by the SRY gene on the Y-chromosome - so sex and the left foot length are likely both independent outcomes from the presence of SRY - but there are likely other factors that influence this too, perhaps developmental hormones or factors, genetics, age, measurement errors?
That being said, it does likely influence the length of the left foot to some degree, based on what we found from the output of the statistical test.
5.5 Using height as response variable
Let’s now look at the relationship between Height and dependent on LengthLeftFoot.
Can you make a scatterplot of the two?
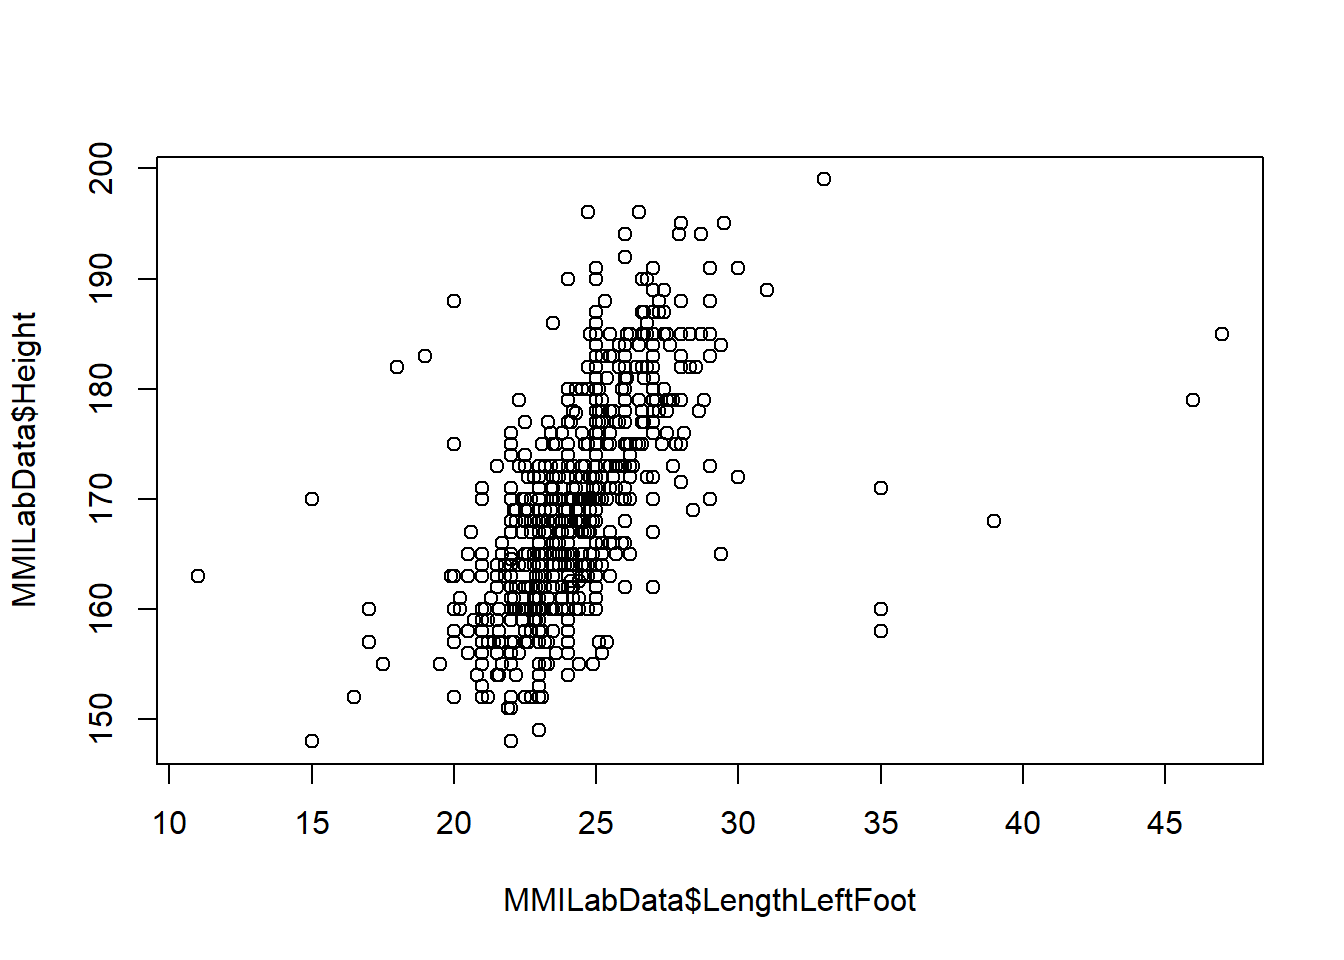
Now, perform a regression analysis for Height dependent on the LengthLeftFoot.
Call:
lm(formula = MMILabData$Height ~ MMILabData$LengthLeftFoot)

Residuals:
    Min      1Q  Median      3Q     Max
-35.370  -4.844  -0.561   4.327  27.602

Coefficients:
                          Estimate Std. Error t value Pr(>|t|)
(Intercept)               118.8814     2.5732   46.20   <2e-16 ***
MMILabData$LengthLeftFoot   2.0758     0.1057   19.63   <2e-16 ***
---
Signif. codes:  0 '***' 0.001 '**' 0.01 '*' 0.05 '.' 0.1 ' ' 1

Residual standard error: 7.638 on 772 degrees of freedom
Multiple R-squared:  0.333, Adjusted R-squared:  0.3321
F-statistic: 385.4 on 1 and 772 DF,  p-value: < 2.2e-16
Add the regression line to the scatterplot.
Now answer the questions about the regression analysis.
Note that to answer the questions about Sex, you’ll need to do another regression analysis (Height as response variable, Sex as predictor variable).
How much of the variation in Height can be predicted by LengthLeftFoot? Express this answer as a percentage, and round to nearest whole number.
Remember, variation in response variable is given by adjusted R-squared.
Perform another regression analysis for Height dependent on Sex. Is LengthLeftFoot or Sex more powerful in predicting Height?
The LengthLeftFoot predicts ~ of the variation in height.
Sex predicts ~ of the variation in height.
Therefore, Sex is slightly powerful than LengthLeftFoot in predicting Height.
Use the variation given by adjusted R-squared to answer this question. Remember, the higher the variation explained the more this accurately predicts the response variable.
Is this meaningfully better?
We’ve asked if the difference in variation in Height being predicted by Sex or LengthLeftFoot is meaningfully better - while both are significant, alone they are not very powerful in predicting Height.
What is the likely cause and effect relationship between LengthLeftFoot and Height?
We did not test whether the LengthLeftFoot depends on Height - as Height was our response variable while LengthLeftFoot was our explanatory variable.
We could instead say that Height and the LengthLeftFoot are independent outcomes of sex - while they don’t depend on sex, it influences these values to a degree. So, the second answer would be acceptable.
Likewise, the last answer is also acceptable - Height will be dependent on other factors.
We might want to expand upon this answer if we were presenting this data and combine our theories, while also referencing further literature.
5.6 Performing regression analysis with multiple variables
Perform a regression analysis of Height dependent on Sex and the LengthLeftFoot.
When we use multiple explanatory variables, we have to change the formula to include them in the design.
So, something like: lm(response_variable ~ explanatory_variable_1 + explanatory_variable_2)
That way, both explanatory variables are accounted for in the relationship with the response variable.
So, try to think about how to write the function so we can see the relationship of Height (response variable) with Sex and LengthLeftFoot (explanatory variable).
How much of the variation in Height can be predicted by LengthLeftFoot and Sex combined? Express this answer as a percentage, and round to nearest whole number.
How confident are we that LengthLeftFoot and Sex are independent predictors of Height? For the values below, round to 2 decimal places
From the previous regression analysis, we found that LengthLeftFoot predicts ~ of the variation in height.
Likewise, sex was found to predict ~ of the variation in height.
If the two explanatory variables are truly independent, then the result of combining the two variables in the regression analysis would result in an additive percentage variation being explained (the two previous percentage variation for either test alone would be added together, so use the previous tests that you ran). So, this would be .
Since the predicted variance for both explanatory variables accounts for only of the variance in Height, Sex and LengthLeftFoot completely independent.
Since the variance explained by both explanatory variables is also either explanatory variable alone, and the p-values for both explanatory variables are 0.05, then they are
What is the formula derived from the regression analysis for predicting Height based on LengthLeftFoot and Sex?
+ ( * LengthLeftFoot) (+ if male) cm
5.7 Make your own hypothesis and test it!
Review the data and the tests that we’ve run so far.
Can you formulate your own hypothesis (one we have not previously addressed), that describes the relationship between two (or more) of the variables previously collected?
This could be something like:
Are the length left finger and the length right finger correlated?
Is either the length of left or right finger correlated with height or sex?
Is the difference in length of the 2nd or 4th digit dependent on height or sex?
Are any length measurements, or sex, associated with hand/foot dominance?
Visualise the variables in a way that provides insight into the relationships between them (boxplots, scatterplots, histograms). If you want to try something we have not yet made, or add arguments to a plot you have made, you can easily Google e.g. “In R, how do I make a bar plot?”, “In R, how do I make a scatter plot?”.
Remember to make your plot visually appealing and only add features that would make sense to add - sometimes less is more.
Perform a statistical test to examine your hypothesis - you’re most likely to use either a chi-square test, a T-test, or linear regression.
5.7.1 Revising statistical tests: what variables, what is tested
The chi-square test will test:
And the variables for this are:
A complimentary plot to go with the chi-squared test would be:
The T test will test:
And the variables for this are:
A complimentary plot to go with the T-test would be:
The linear regression test will test:
And the variables for this are:
A complimentary plot to go with the linear regression would be:
Which test did you use?
Did you gain evidence to support your hypothesis?
How certain are you that the association didn’t occur by chance?
What is the likely cause and effect relationship between your variables, if there is one?
This is the end of the tutorials, so hopefully you have some more confidence in using R and RStudio for data analysis.
If you didn’t finish the labs we strongly recommend doing so in your own time, as R is the default software we’ll use for data analysis in the rest of Level 2, Level 3, and Level 4.
This barely scratches the surface of all the amazing things you can do in R, so if it was interesting for you please do feel free to play around in your own time with online tutorials or datasets - you can do really cool things like create maps overlaid with population data, look at differences in gene expression between disease and healthy controls to find biomarkers of disease, or get familiar with crazy packages like replacing points on a graph with cats, or using a Barbie theme!